MARYDIANA NJOROGE
Data Analytics · Python · SQL · Power BI · Excel
Data Analytics · Python · SQL · Power BI · Excel
Hello, welcome to my portfolio website!
I’m Marydiana Njoroge, a Bachelor of Science in IT student and data analytics professional with a passion for uncovering insights from data and transforming them into meaningful stories. I enjoy building solutions that blend analytical thinking with creativity, whether it’s designing intuitive dashboards, developing AI-driven tools, or optimizing business processes.
Beyond the screen, I thrive on trying new experiences—exploring new restaurants, enjoying good conversations, coloring, crocheting, or immersing myself in music. I also appreciate the quiet moments of simply relaxing in my own space. This balance between curiosity and focus reflects how I approach my work: with precision, creativity, and adaptability.
Through this portfolio, you’ll find a collection of my projects that highlight not just technical skills in SQL, Python, Excel, and Power BI, but also my ability to connect data with real-world impact. My goal is to continuously learn, grow, and contribute to building innovative solutions in technology and analytics.
In the fast-paced world of telecom, customer loyalty is everything. What if you could spot the customers most likely to leave before they actually churn? That’s the question I set out to answer.
Using 7,000+ telco customer churn records, I built an end-to-end machine learning pipeline that predicts churn with over 80% accuracy. The solution goes beyond just numbers; it’s packaged into a sleek Streamlit web app where users can explore data, visualize insights, and even test predictions live.
Sepsis is a life-threatening condition where every hour of delayed treatment reduces survival rates. The goal of this project was to use machine learning to predict sepsis onset early and provide healthcare teams with actionable insights.
Using Kaggle’s dataset, I built and evaluated multiple ML models, with Logistic Regression achieving the best recall score. The final model was then deployed as a RESTful API using FastAPI, and will soon be containerized with Docker for scalable deployment.
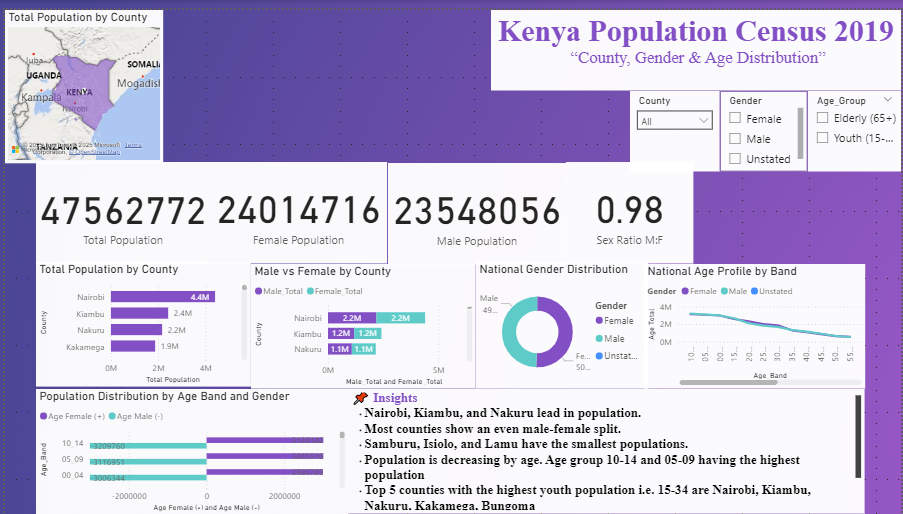
/predict, /)Curious about Kenya’s population distribution? I used the 2019 census data from Humanitarian Data Exchange to build an interactive Power BI dashboard and uncover insights about key demographic groups.
The dashboard features interactive KPI cards, charts, and slicers that make it easy to explore the distribution of population by county, gender, and age cohorts. Through data transformations, error handling, and dynamic DAX measures, the report delivers actionable insights into population distribution, youth representation, and aging trends, highlighting disparities across counties that are critical for effective policy planning, social programs, and resource allocation.
Say hello at njorogediana236@gmail.com